Every racecard in thoroughbred racing prints final running times, yet relying on raw stopwatch clockings is one of the fastest ways to lose your bankroll. A horse stopping the timer in 1:09.03 over 1200 meters on firm turf at Sha Tin Racecourse is operating in a completely different physical environment than a sprinter clocking 1:12.10 over deep sea-sand at Seoul Racecourse or 1:12.49 under the floodlights at Ohi Racecourse. Even on the exact same oval, a 1600-meter mile at Tokyo Racecourse runs nearly two seconds faster on a high-cushion autumn afternoon than on rain-softened spring turf—while an adjacent dirt race at the same meeting will paradoxically speed up by more than a full second when rain compacts the sand.
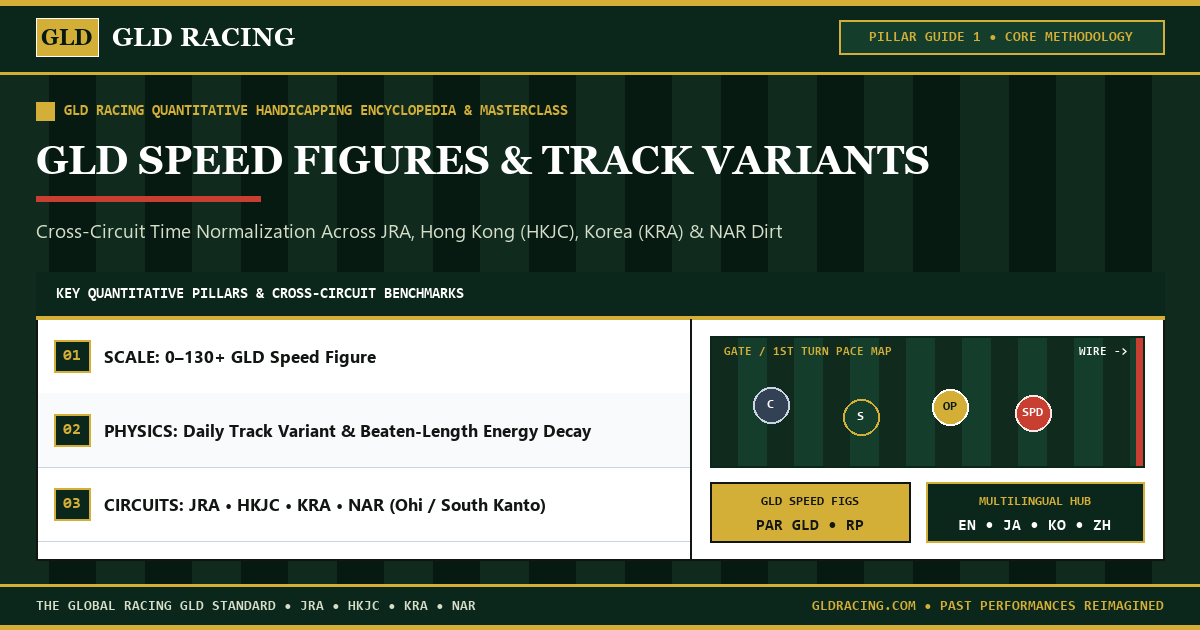
GLD Speed Figures solve this fundamental handicapping problem. Calibrated across 865,435 historical starts in our GLD Class Par benchmark repository (see International Class Par Benchmarks), GLD Speed Figures strip away environmental noise—circuit geometry, surface friction, daily wind and moisture variants, distance energy decay, and weight carried—to isolate a runner's pure athletic output on a single standardized scale. Whether you are handicapping a Grade 1 showdown on the Japan Racing Hub, a midweek night card on the Hong Kong Racing Hub, or a weekend sand card on the Korea Racing Hub, a figure of 90 means the exact same level of equine performance relative to class par.
1. Why Raw Finish Times Mislead Bettors Across International Circuits
Raw final time is the product of four entangled variables:
- Intrinsic Equine Velocity: How fast the horse actually propelled itself from gate to wire.
- Course Architecture & Elevation Geometry: Turn radius, banking cant, homestretch length, and uphill climbs—such as the grueling 2.0-meter homestretch incline at Tokyo or the steep 2.2-meter climb at Nakayama compared against flat speed ovals like Happy Valley or Ohi.
- Surface Shear Strength & Moisture Elasticity: How turf root density, synthetic wax binding, or sand granule moisture alters hoof energy return (Track Going & Moisture Impact).
- Tactical Pace Distribution: Whether the field dawdled through a slow opening half-mile before sprinting home, or engaged in a destructive early speed duel (Mastering First-Turn Pace Maps).
When public bettors see a flashy final time in standard past performances, they frequently over-bet horses that merely benefited from a wind-aided turf strip or a sealed, waterlogged sand surface. Conversely, runners that posted a visually slower raw clocking against a severe headwind, a freshly harrowed deep sand cushion, or a wide trip on the C+3 movable rail (Track Bias & Barrier Statistics) are routinely dismissed at double-digit odds despite running the superior athletic race.
2. The Empirical Foundation: 865,435 Starts & Cross-Circuit Class Pars (GLD Class Par)
To build a universal speed figure scale without arbitrary manual adjustments, GLD Racing engineered the GLD Class Par benchmark matrix from 865,435 verified race starts ordered across our four core circuit tiers:
- Priority 1 — JRA Central Racing (263,683 starts): All 10 central venues (Tokyo, Kyoto, Nakayama, Hanshin, Chukyo, Niigata, Kokura, Sapporo, Hakodate, Fukushima) across turf and dirt.
- Priority 2 — Hong Kong Jockey Club (48,557 starts): Sha Tin Turf, Sha Tin All-Weather Track (AWT), and Happy Valley Turf across Class 1 through Class 5, Griffins, and Group stakes.
- Priority 3 — Korea Racing Authority (134,084 starts): Let's Run Park Seoul and Busan-Gyeongnam across Class 6 through Class 1 and Graded stakes.
- Priority 4 — NAR Regional Dirt Racing (419,111 starts): Led by Tokyo City Keiba (Ohi), Kawasaki, Funabashi, Urawa, Mombetsu, Sonoda, and Nagoya.
For every combination of venue, surface, distance, and class division, we compute the winsorized empirical mean winning time (par_time), standard velocity in meters per second (par_speed_ms), and the anchor Benchmark GLD Speed Figure (explore the full interactive tables on `/stats/class-pars`).
| Circuit Priority | Venue & Surface | Distance | Official Class Tier | Empirical Par Time (GLD Class Par) | Par Velocity (m/s) | Benchmark Par GLD | Historical Sample (N) |
|---|---|---|---|---|---|---|---|
| 1. JRA Central | Tokyo Turf | 1600m | Grade 1 (G1) | 1:33.67 | 17.08 m/s | 118 | 133 |
| 1. JRA Central | Tokyo Turf | 1600m | 3-Win Class | 1:33.95 | 17.03 m/s | 92 | 1,224 |
| 1. JRA Central | Tokyo Turf | 1600m | 1-Win Class | 1:34.55 | 16.92 m/s | 76 | 5,336 |
| 2. Hong Kong (HKJC) | Sha Tin Turf | 1200m | Grade 1 (G1) | 1:08.12 | 17.62 m/s | 118 | 12 |
| 2. Hong Kong (HKJC) | Sha Tin Turf | 1200m | Class 2 | 1:08.77 | 17.45 m/s | 90 | 44 |
| 2. Hong Kong (HKJC) | Sha Tin Turf | 1200m | Class 3 | 1:09.03 | 17.38 m/s | 75 | 186 |
| 2. Hong Kong (HKJC) | Sha Tin Turf | 1200m | Class 4 | 1:09.36 | 17.30 m/s | 54 | 300 |
| 2. Hong Kong (HKJC) | Happy Valley Turf | 1200m | Class 3 | 1:09.62 | 17.24 m/s | 75 | 207 |
| 3. South Korea (KRA) | Seoul Sand | 1200m | Class 1 | 1:12.10 | 16.64 m/s | 90 | 52 |
| 3. South Korea (KRA) | Seoul Sand | 1200m | Class 3 | 1:13.30 | 16.37 m/s | 74 | 230 |
| 3. South Korea (KRA) | Busan Sand | 1600m | Class 1 | 1:38.80 | 16.19 m/s | 90 | 13 |
| 4. NAR Regional Dirt | Ohi Dirt | 1200m | JpnI | 1:10.66 | 16.98 m/s | 114 | 78 |
| 4. NAR Regional Dirt | Ohi Dirt | 1200m | A1 Class | 1:12.49 | 16.55 m/s | 90 | 971 |
| 4. NAR Regional Dirt | Ohi Dirt | 1200m | B1 Class | 1:13.48 | 16.33 m/s | 76 | 1,237 |
| 4. NAR Regional Dirt | Ohi Dirt | 1200m | C1 Class | 1:14.98 | 16.00 m/s | 56 | 6,376 |
Notice how the benchmark hierarchy aligns athletic output across borders: a top-level domestic handicap winner in Hong Kong Class 2 (1:08.77 at Sha Tin 1200m), a KRA Class 1 winner (1:12.10 at Seoul 1200m), and an NAR A1 winner (1:12.49 at Ohi 1200m) all converge on a standardized Par GLD of 90, while elite international Group 1 performers such as ROMANTIC WARRIOR, KA YING RISING, EQUINOX, and FOREVER YOUNG scale into the 115–124 tier.
3. Daily Inter-Quartile Track Variants (ITV) & Surface Going Inversion
Once baseline par times are established, the second stage of the GLD Speed Figure pipeline calculates the Daily Inter-Quartile Track Variant (ITV).
Why Simple Average Variants Fail
On a 10-race card at Happy Valley or a 12-race program at Tokyo, one or two races may be run at a crawl due to a lack of early pace, while another race may feature an anomalous track-record blowout by a future Group 1 star like KA YING RISING. If a speed figure system averages all races on the card equally, a single tactical crawl or superstar performance corrupts the variant for every other race that day.
GLD Racing eliminates this distortion using Inter-Quartile Trimmed Deviations:
- For each race $r$ on a given card and surface, we compute the raw time deviation $Delta t_r = t_{ ext{actual}, r} - t_{ ext{par}, r}$ relative to the specific field's competitive strength (Par GLD vs. Race Power).
- We discard the fastest 25% and slowest 25% of race deviations on that surface, isolating the inter-quartile core (25th to 75th percentile) where true surface speed resides.
- For meetings where weather shifts mid-card—such as a sudden downpour at Sha Tin or moisture evaporating across an afternoon at Seoul—we apply an intra-card rolling spline weighted by official penetrometer, JRA Cushion Value, and KRA sand moisture readings.
The Physics of Turf vs. Dirt Moisture Inversion
One of the most profitable edges documented in our Track Going & Moisture Impact Portal is the opposite physical behavior of turf versus sand/dirt surfaces when moisture increases:
| Circuit & Surface | Going / Moisture State | Empirical Time Impact vs. Par | Velocity Shift (m/s) | Tactical Bias Shift |
|---|---|---|---|---|
| JRA Turf | Firm (Cushion 9.5–10.5) | 0.0s (Baseline Par) | +0.00 m/s | Favors Final 3F (Agari 3F) acceleration |
| JRA Turf | Soft / Heavy (Moisture 12%–17%+) | +1.4s to +2.2s Slower | -0.28 to -0.45 m/s | Stamina & high-OWD wet-turf pedigrees |
| JRA Dirt | Dry Standard (Good) | +0.8s Slower | -0.18 m/s | Deep loose sand demands sustained power |
| JRA Dirt | Wet / Sloppy (Moisture 12%–17%+) | -1.2s to -1.6s Faster | +0.31 to +0.42 m/s | Compacted gliding sand favors high EP speed |
| HKJC Turf | Good to Firm (Penetrometer <= 2.65) | -0.5s Faster | +0.16 m/s | On-pace stalkers (OP) & high-velocity sprinters |
| HKJC AWT | Wet Fast All-Weather | -0.9s Faster | +0.27 m/s | Wire-to-wire front-runners (SPD) dominate |
| KRA Sand | Dry Sand (3%–5% Moisture) | +1.4s to +1.8s Slower | -0.25 m/s | Deep sand drag sets up G3F closers (C) |
| KRA Sand | Muddy / Sloppy (15%–20%+ Moisture) | -1.5s to -1.8s+ Faster | +0.30 to +0.40 m/s | Inside Gates 1–4 early speed (SPD) |
| NAR Dirt (Ohi) | Sealed Sloppy Dirt | -1.6s to -2.2s Faster | +0.38 m/s | First-turn rail leaders dominate |
Without proper variant subtraction, a bettor looking at a Korean runner that clocked 1:12.50 on a 19% sloppy track at Seoul will mistake a mediocre Class 4 front-runner for a Class 1 star. GLD Speed Figures automatically deduct the -1.6s moisture acceleration, revealing that the runner only achieved a 64 GLD figure—whereas GLOBAL HIT grinding through a 4% bone-dry track in 1:12.60 earned an elite 93 GLD figure after receiving positive credit for the deep sand drag.
4. Distance-Specific Beaten-Length Physics, Weight & Rail Geometry
Computing the winner's speed figure is only the beginning; 90% of the runners in any past performance grid finished behind the winner.
Inverse Distance Beaten-Length Scaling
A single beaten length (approximately 2.4 meters) does not carry a constant value across all distances. In an explosive 1000-meter turf dash down the straight chute at Sha Tin or Niigata, horses are traveling at 17.65 m/s, and being beaten by 2.0 lengths represents a large deficit relative to total race duration. Over 2400 meters in the Japan Cup at Tokyo, 2.0 lengths is a fraction of total energy expenditure.
GLD Speed Figures scale points-per-beaten-length using a continuous inverse distance function:
where $ ext{BL}$ is official beaten lengths (supplemented by electronic finish-time margins to the hundredth of a second), $d$ is race distance in meters, $d_{ ext{ref}} = 1400 ext{m}$, and $kappa_{ ext{surface}}$ accounts for velocity dispersion on turf versus deep sand.
Weight Carried & Course Rail Geometry Adjustments
In handicap jurisdictions like Hong Kong and Korea, imposts swing from 115 lbs (52 kg) at the bottom of the weights to 135 lbs (61 kg) at the top. Simultaneously, Hong Kong rotates its movable turf rail across Course A, B, C, and C+3 (Track Bias & Rail Shifts). On Happy Valley Course C+3, inside barriers (Gates 1–4) post a 14.8% victory rate compared to just 3.2% for outside barriers (Gates 9–12) due to severe centrifugal ground loss on the tight turns. Our rating pipeline normalizes for impost deltas and rail path geometry so that a runner carrying 135 lbs wide on the C+3 rail is properly credited for its true physical effort.
5. How GLD Speed Figures Power Your Race-Day Workflow
When you open the Free Sample Racecard Preview or unlock a full card on Racecards & Passes, GLD Speed Figures appear in two places:
- Individual Running Lines (
GLDColumn): Every past performance line displays the exact standardized GLD Speed Figure earned in that start, alongside the field's Race Power (`RP`) and sectional splits (Early Pace `EP` & Late Pace `LP`). - Projected GLD Power Rating: Directly beneath each runner's name and pedigree line, our regressor synthesizes recent GLD Speed Figures using exponential recency decay, form-cycle trajectory slope, weight shifts, and today's surface/distance suitability into a single forward-looking rating. Across our historical backtest, the highest-rated GLD runner wins at a
19%strike rate across large international fields—providing the anchor for the GLD Line & Exotic Wagering Blueprint.
Frequently Asked Questions (FAQ)
Q1: Can I directly compare a GLD Speed Figure earned at JRA Tokyo with one earned at Sha Tin or Seoul?
Yes. Every GLD Speed Figure is anchored to the universal GLD Class Par benchmark scale across 865,435 starts. A 90 GLD Speed Figure represents standard Class 2 performance in Hong Kong, Class 1 performance in South Korea, 3-Win Class performance in JRA Japan, and A1 Class performance at NAR Ohi. You can inspect the complete cross-circuit conversion table on our International Class Par Benchmarks page.
Q2: Why did a horse that ran a faster final time receive a lower GLD Speed Figure than its previous start?
Final times fluctuate heavily with daily track variants and surface moisture. For example, on Korean sand at Seoul or Japanese dirt at Ohi, rain compacts the sand and accelerates race times by 1.2 to 1.8 seconds (Track Going & Moisture Impact). A horse running 0.5 seconds faster on a sloppy track actually ran a slower athletic race once the -1.5s track variant is deducted.
Q3: How does GLD Racing rate First-Time Starters (FTS) and Privately Purchased Griffins (PPGs) that have no prior speed figures?
For unexposed debutants—such as JRA Newcomers or Hong Kong PPGs—we anchor their initial projection using our GLD Master Pedigree Rating (0–100) and Offspring Winning Distance (OWD), which synthesize sire and dam sibling speed figures, surface aptitude, and precocity priors. Explore our Hong Kong Pedigree & Breeding Analytics Hub for full details.
Q4: How should I combine GLD Speed Figures with Race Power (RP) and the GLD Line when betting?
First, compare each runner's recent GLD Speed Figures against today's Par GLD and Projected Race Power (read our Par GLD vs. Race Power guide). Second, verify that the horse's tactical running style (SPD, OP, PCK, C) aligns with today's First-Turn Pace Map. Finally, demand a positive price edge over the projected GLD Line (read the Exotic Wagering Blueprint).
GLD Racing is an independent analytical service and is not affiliated with or endorsed by The Hong Kong Jockey Club (HKJC), Japan Racing Association (JRA), National Association of Racing (NAR), or Korea Racing Authority (KRA). All data and speed figures are provided for informational and analytical purposes. 18+ | Please Gamble Responsibly.